Afternoon trading the Emini SP500
-
Statistically Valid
(4)
-
Ease of Use
(4)
-
Simple to Master
(5)
-
Robustness
(5)
-
Durability
(5)
Summary
Day trading is hard. Put the odds in your favor with the Afternoon Delight trading strategy for the Emini SP500 futures contract.
For those looking for an automated strategy that waits for the best opportunity to strike, then late afternoon momentum trading is as simple and easy as it gets.
Although the name of this strategy is ridiculous, it actually works really well. In fact, just about every successful trader that I know uses a derivation of this super simple strategy.
Download it, study it, use it. Change it into something uniquely original to you. Use it as a foundation in which your imagination may flourish.
Today I wanted to talk about a well-known market bias, and how you can incorporate this bias into an actual trading strategy for the Emini SP500 futures contract.
A lot of traders will look at a chart and they will see ‘patterns’ emerge. In fact, there is an entire industry of hucksters, charlatans, and carnival barkers with all sorts of ‘magical’ trading indicators and methods that proclaim to have supernatural predictive powers.
If you have read the TradingSchools.Org blog for awhile, then you are probably aware that there is nothing ‘magical’ in financial markets. It’s just a bunch of confusing data in which our mind will attempt to organize and apply a logical order.
Unfortunately, the human mind is uniquely flawed for this particular task. We are susceptible to something called Patternicity. In short, we think we are seeing the face of Christ on our toast when in reality the toaster randomly created an image and our mind quickly filled in the blanks.
Most traders are stuck in the never-ending loop of looking for Jesus in the toast. This form of analysis will lead you down the well-worn path of either A) Blowing out yet another trading account, or B) Purchasing yet another magical trading indicator (aka Jesus Toaster).
Familiarize yourself in the theory of Patternicity. The next time you look at the chart, and you think you are seeing something…remember the theory of Patternicity. Are you just fooling yourself? Are you just seeing ‘Jesus on your toast?’ Once you have reached this critical threshold of questioning yourself, then you are ready to discover a better path forward.
A better way to analyze financial markets
In my opinion, a better way forward is to use modern data analytics to discover repeatable biases within financial markets. In short, we toss the Jesus Toaster and rely on modern tools that allow us to ask questions of the markets, and allow modern computers to give us the answers.
In short, we backtest theories by writing computer code and then apply the code to the data. From this, the truth begins to emerge.
Does testing of financial theories actually work? Yes. Just ask James Simons of Renaissance Technologies.
There are plenty of computer programs that allow the backtesting of financial data. They all claim that “We are the easiest to learn.” They all lie. Whether it be NinjaTrader, TradeStation, MultiCharts, ThinkOrSwim, or MetaTrader, the truth is that none of these programs are easy to learn.
However, I have used all of them. And I have found that the easiest to learn, combined with the most robust (human to human) support is with the Trade Navigator platform. I don’t mean to disrespect my friends at NinjaTrader, TradeStation, Multicharts etc. They are all excellent platforms. But in terms of taking an absolute fucking idiot like myself (High School drop-out, ex-Convict) and turning that person into a decent quantitative analyst…Trade Navigator is the best choice.
You can get a free trial of Trade Navigator through the following link. They normally charge $7 for a “Guest Pass” but the link bypasses the $7 fee.
Ok, I will get off my soapbox and start talking about a robust, intraday trading strategy that can be used for the Emini SP500 futures contract.
Emini SP500 tends to close at the extreme.
The random walk hypothesis states that stock market prices evolve according to a random walk. Thus they cannot be predicted. This is mostly true.
However, a quick test of the SP500, going back to the 1970’s reveals that the closing price tends to close within the top 20% or the bottom 20% of the daily range. What exactly does that mean? In short, there is approximately a 28% chance that the market will close at a threshold of greater than 80% of the daily range or lower than 20% of the daily range.
If you are confused, that’s OK. The key point to remember is that the stock market tends to close at near the high of the day, or near the low of the day. The stock market typically closes at the extremes.
And so in practical terms, if there are only 30 minutes remaining in the day, and the market is heading higher…you don’t want to be shorting!!!
With this useful bit of information. We can build a simple trading strategy that attempts to exploit what is highly apparent.
When to take a trade
Since we know that the stock market tends to close at the extreme. Then it only makes sense to wait as long as possible to enter a trade. Yet, keep enough time on the clock so that the trade has time to run and (hopefully) outpaces commission and slippage.
For our strategy, we are only going to take trades in the afternoon of the trading session. Trading begins in Chicago at 8:30 with a big spike in volume. The volume gradually slows and then bottoms around 12 noon Chicago time. We are not interested in the morning or the lunchtime. We are only interested in taking trades after the morning news and lunchtime doldrums. Therefore, we will only take trades after 12 noon Chicago time.
The set-up
Ok, its now afternoon and we are looking for a trade. We know that the market tends to close at the extreme, so we want to go with the primary afternoon trend. The simplest and most robust is to simply buy if the market is above the open and sell if below the open. But this is only a breakeven trade. We want profits. So we are looking for a specific condition.
The specific condition we are looking for is MOMENTUM. How do you define momentum? Truth be told, nearly every single indicator on every single trading platform has oodles and oodles of ways to measure momentum. An overbought stochastic or MACD measures momentum, any old fancy oscillator works just fine as well. You don’t need anything fancy.
For me, I use the Momentum Indicator. Just like the name says, the Momentum Indicator. What is it? All it does is measure the least square (best fit) of closing prices over a set period of bars.
Many readers are probably flummoxed and exasperated, saying to themselves “But what setting!!!” The truth is that just about any setting works just fine.
But remember Newton’s First Law of Motion (Law of Inertia) that “An object at rest stays at rest and an object in motion stays in motion.” So you need to pick a Momentum setting that works across an entire neighborhood of settings. If your car is traveling at 80 mph you can win a few races, but if your car is traveling at 120 mph, you will win even more races. Use common sense. Test Momentum across the entire plane of possibilities. You will be surprised at how well it works.
For this article, we are going to use a Momentum setting of 5/5/5. All this means is that we are measuring the momentum of 5-minute bars, over a period of 25 minutes, with a setting of 5. There is no mystical or magical meaning to 5/5/5. As a matter of fact, 6/6/6 works even better. But that would be a sign of Satan! Who wants to trade in league with the Devil, not me!
Once again, I cannot stress this enough…the settings are not that important. As a matter of fact, I created this strategy over 15 years ago, and have never changed anything. Nor have I looked at alternative settings. I don’t need too. It super simple, super robust, and tough as nails. It just works.
The Results
Lets take a peek at the results of our stupid simple, afternoon trading system…we are testing the following parameters:
- Set up a 5-minute bar chart of the Emini SP500
- Apply standard Momentum indicator with setting at 5/5/5
- Only take trades after 12 noon Chicago time.
- Go with the trend. When Momentum crosses above 5, we go with the prevailing trend.
- Exit at the end of the day.
- No stop losses.
No stop losses. You are reading that correctly. Yes, can add stop losses and theoretically super-charge your performance into “perfect performance”, but this is a trap.
The truth is that stop losses on intraday systems only worsen performance. You can add a catastrophe stop loss of $1000 per contract, but it doesn’t improve or worsen performance. Whenever you start removing degrees of freedom from a trading system, it only makes the system more fragile. A better statistic is to look at Maximum Adverse Excursion and determine whether you can live with the historical drawdown.
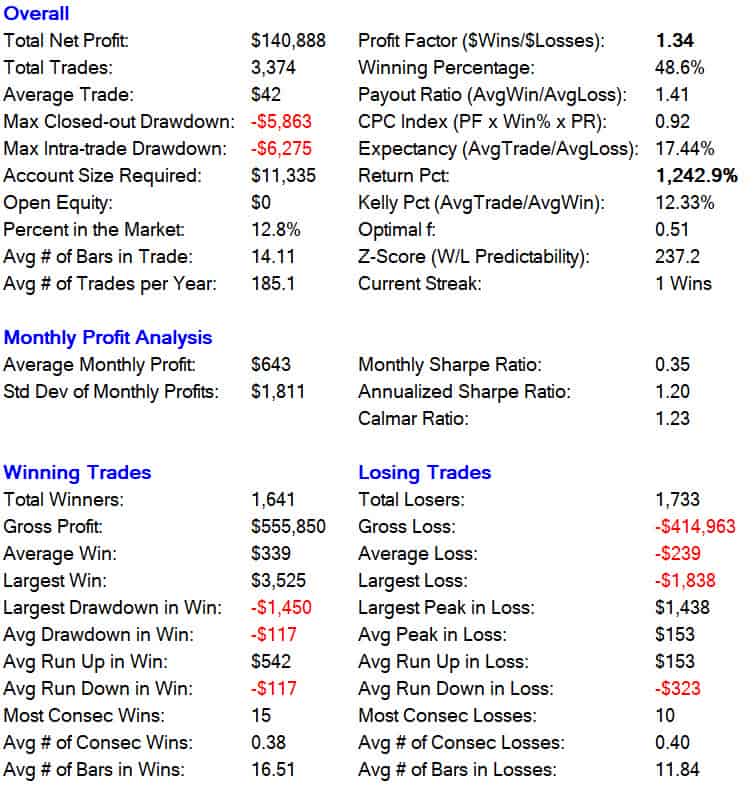
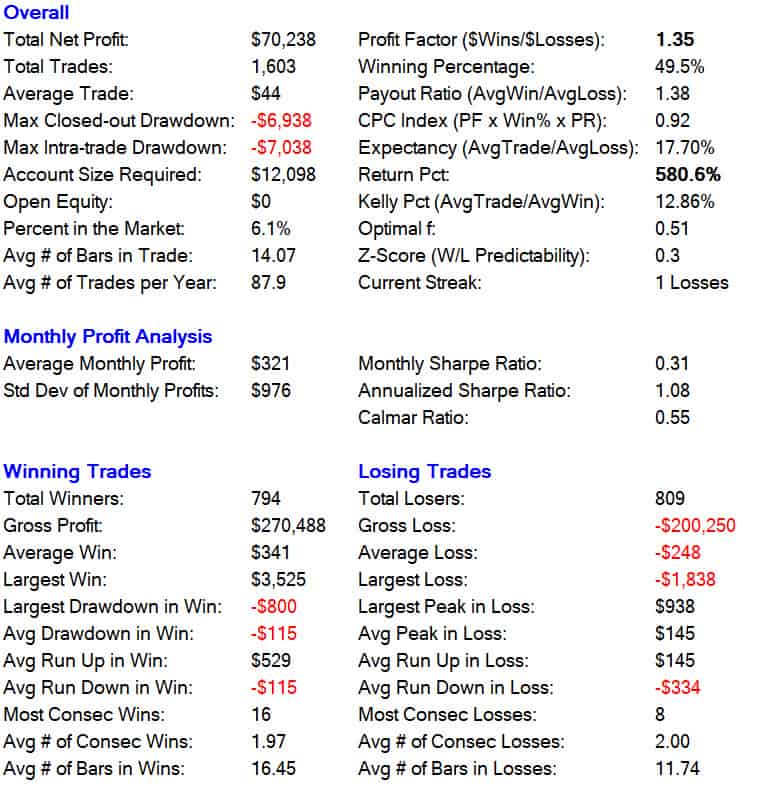
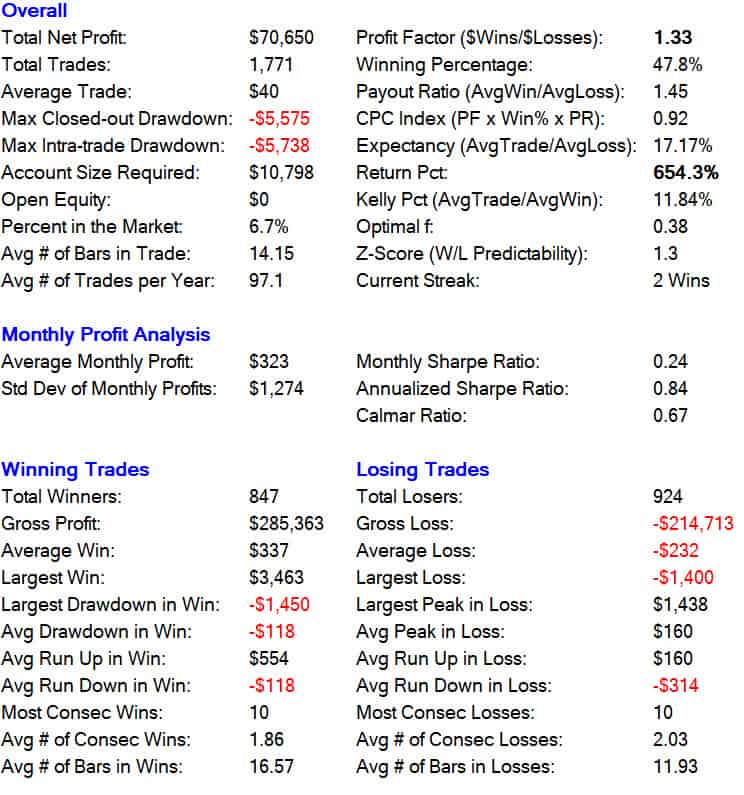
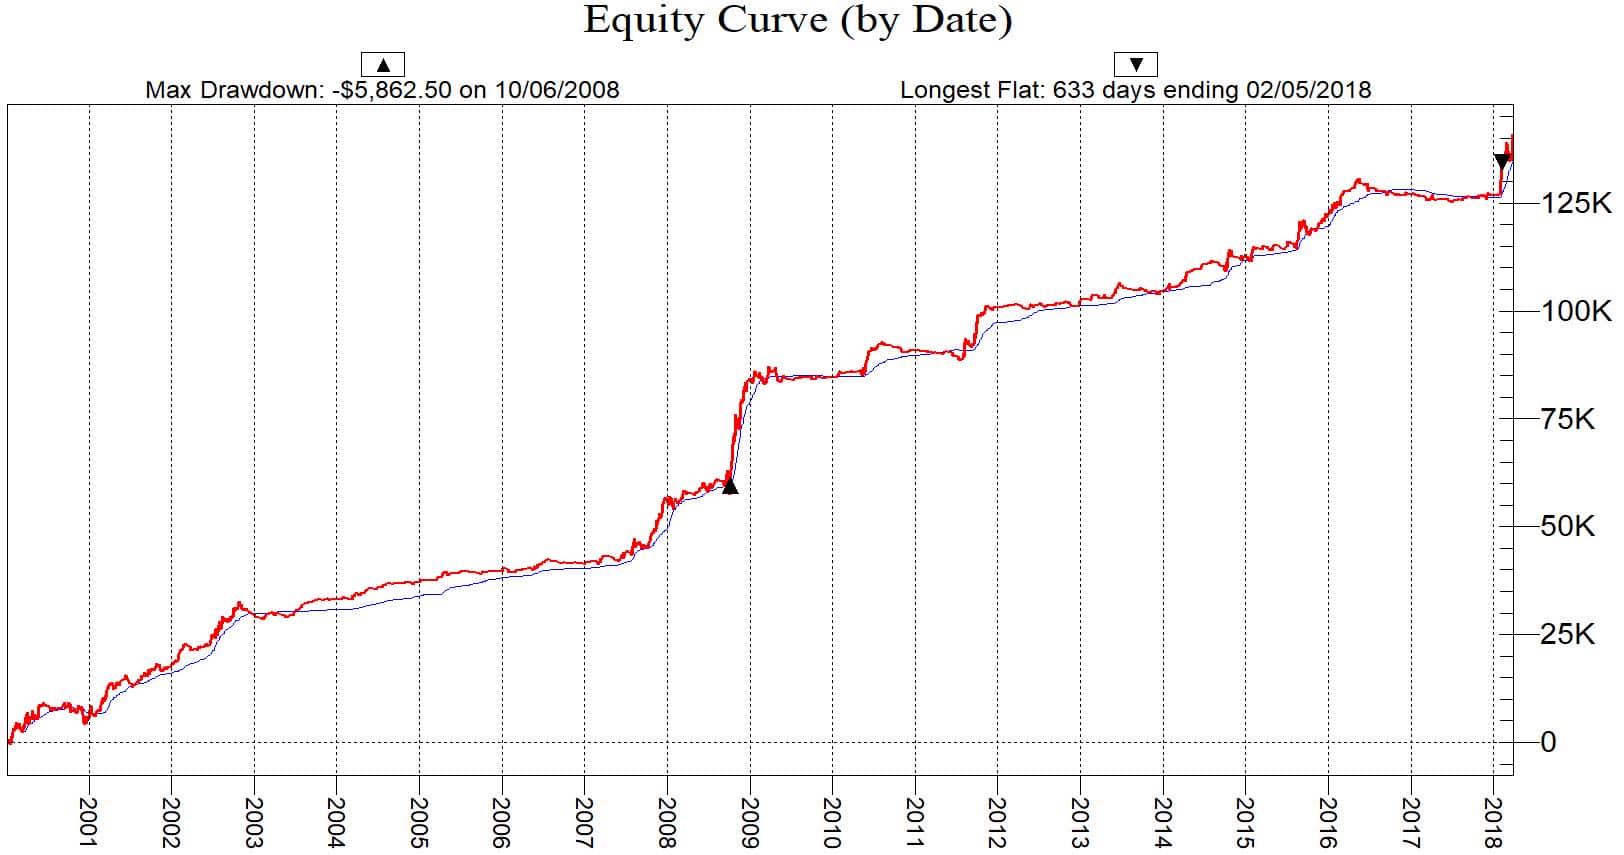
Here are the results for the Emini SP500 from January 1, 2000 through March 27, 2018. Keep in mind that these results are out-of-sample for 15 years. Not a single thing has been changed.

Long Only Trades

Short Only Trades

Combined Equity Curve

What is most impressive
In my opinion, what I find most impressive about this simple trading strategy is how well it captures a down trending stock market. Notice the incredible performance for 2008 and the how the performance is spiking in 2018, another down-trending market.
I expect 2018 to be another really, really good year for this particular system.
But what can you realistically expect from this system? We have not even talked about slippage and commission! The truth is that for any Emini SP500 intraday trading system, you should automatically deduct $10 from each and every trade. So for this particular trading system, the actual performance is just above $30 per trade, per contact.
How can we improve performance?
I don’t want to ‘give away the store’ but you can actually improve this strategy quite a bit, without overly optimizing or curve fitting. For instance, what if you only take trades Monday through Thursday? Just toss out Friday’s, which historically are days in which the market tends to meander? You get a nice uptick in performance from $44 average trade to $54 average trade.
Or, what if you add a qualifier that incorporates what is happening in the US Treasury Bond and Notes markets? If money is flowing heavily into Treasury Bonds and Notes, then doesn’t it make sense that money is heavily flowing out of the stock market? Once again, without ‘giving away the store’ you can actually increase performance yet again to nearly $70 per trade and yet retain a large sample size. Just by adding a tiny little qualifier. Very simple.
Let your imagination lead you! What if the Emini Nasdaq futures have a higher or lower intraday percentage change than the Emini SP500 futures contract? If the Nasdaq is quickly rallying or quickly declining, how can we add this as an additional qualifier? My lord. You should check there!
Wrapping things up
The point I am trying to make is that in order to fully take control of your future, you need to start backtesting theories. Become independent, and finally throw away the ‘Jesus Toaster’, you need to learn how to program, backtest, and most importantly AUTOMATE the process of trading.
Stop wasting your time with the latest and greatest magical trading indicator being sold from a guy that should be working at a carnival.
The following is a link to Trading Navigator. After you download and set it up. Then download the file below titled: Afternoon Delight. This is the complete system in which you can import and start playing around with the strategy. (No, I have no financial incentive with Trade Navigator)
Take it, and make it uniquely yours. Twist and turn the variables, add your own theories, show off your creativity. Report back with big profits.
And I will leave you with some real Afternoon Delight. Thanks for reading.


Do you run this strategy Long only, or do you use it if Momentum is -5.00 or greater for a short?
What is a standard momentum indicator wit 5/5/5 setting. Can someone guide me please ?
What is the average drawdown per trade?
This will let traders know what risk exposure they need to take on with this strategy.
My bad just re-read, you can delete this comment please
Can’t stop watching the music video
“go with trend”what do you define as trend for this system ?
try to review hedgetradingsystem.com, the strategy feel works good!!
I couldn’t understand when/how the momentum comes into play. What shall I look for in the indicator? A level? overbought/oversold levels?
Loved the article, and the strategy though I don’t even trade the SP500. I will start paper trading it using this. Another proof that “high school drop-out, ex-convict” is hardly a measurement for intelligence or reasoning. Same goes for formal education (completely useless nowadays) most important lesson is to throw away the Jesus toaster. Sad truth that the people who are selling them are the ones who are actually making all the money.
Hi Emmet, just wanted to say thank you for this. I’ve been looking for a place to start and everything one needs to start is in this great article. Thank you again.
I did a brief backtest on limited data but it looks to me that this strategy doesn’t perform nearly as well on the Dow or Nasdaq minis. I would think they would be highly correlated, no?
Hi Emmett, I was referring to the “Afternoon Delight” strategy on the ES – it doesn’t perform nearly as well on the Dow or Nasdaq minis
Correct. The ES, Dow, or NQ pretty much march in lockstep. But Berkshire Hathaway is a unique beast.
Emmett, are you having an brainfart? Read Kris’s comments again, carefully, and reread your responses… Please. Please.
I might have had a brain fart. I do this quite often.
This is bizzare. Why are you talking about berkshire? This is an emini s&p500 strategy… Or so it says in the article. Whos crossed their wires here?
would it be a good idea trading the sp500 cfd instead of Emini SP500?
to have less fee?
Sure. Or the SPY, SP500 options, or binaries.
The most transparent market, with the tightest and truest spread, is going to by the ES. Then the SPY.
Ok I am sooo noob I don’t even understand this article! Emmett can you recommend a place to start learning to trade? An honest mentor for a beginner?
I finally realized what a scammer you are Emmett. You are not disclosing that people like John Carter have paid you to not review them. You need to disclose information like that. I bet you signed a non disclosure. What a fraud.
John Carter paid me to not review him? Not sure what dark corner of the internet you pulled that out of?
I have no problem reviewing John Carter. Would you like to see a review of him?
Yes I would. I appreciate your response. Please do.
I’m convinced any profit he makes is only because he has so much subscriber/trading course money coming in that he can sit through trades going against him that his subscribers can’t. He only shows winning trades in his videos and he markets his successes like a $5k account can duplicate. At this point I think everyone in this industry is a scam.
Emmett, I’ve been watching this site for a long time and I appreciate all the work you put into it, plus the time and advice. But I’ve got to disagree with one point here.
I’ve been trading for a long time and I think the worst piece of advice you can give a new trader is not to use stops. That’s a recipe for blowing up more than one account. In your statistics, it shows maximum intraday drawdown of more than $6,000. How many new traders will stand for that? How many will exit with $1500, $2000, $3000, or more because they can’t stand the heat. Even $1000 catastrophe stop is a hard lesson for a new trader.
So even if over the long term it works and your average trade is $44, how do you justify the $6,000 intraday drawdown.
It may be hard for a new trader to figure out stops, but it must be done. Each trader needs to have a setup — why they will take a trade, an entry price, targets to take profit and, yes, a stop loss to limit the damage and be able to take the next trade.
Losses are a part of trading. Limiting losses (in my humble opinion) is the way to stay in the game and become a successful and profitable trader.
Don’t mean to rant or step on your parade but I really disagree here and have learned the hard way. It wasn’t until I defined how I would use stops that my trading became very profitable and more importantly, consistent.
Suffering a $6,000 drawdown will take so many trades at $44 profit, how do you justify that? New traders should think very carefully about that as a strategy.
Just my 2 cents.
One more thing: Statistics don’t have any emotion. Let a trader take a $6,000 drawdown intraday and then tell me his emotions aren’t involved. Fear is the big enemy of a trader. Controlling that fear, overcoming that with discipline and a positive return on a series of trades is essential to trading success.
Actually, you can add qualifiers that reduce drawdown dramatically. My own variation has a max draw of $1800 with an average trade of $69. But of course, this reduces the sample size and creates a more ‘fragile’ system.
I like my trading systems like my women–fat, hearty and tough.
The ‘holy grail’ is to have a lot of systems that work over many different market regimes. All combined and automated. Once you have a bunch of hearty systems (even the big drawdown systems), you can combine and monte carlo the entire portfolio. This gives you a much more accurate and realistic expectation of drawdowns.
No worries on hurting my feelings. I enjoy a vigorous and lively debate.
“Different strokes for different folks.” (Sly and the Family Stone, circa 1969 (gives my age). I use the one and only system I developed on all markets and all time frames. I day trade and swing trade with that system. I suppose what you are describing here are more mechanical systems that don’t require a lot of attention if they are intraday trading vehicles. I wouldn’t be able to handle a ‘bunch of hearty systems” (guess that’s why I like different women than you, the hearty and tough ones scare me too much:}).
And again, I’m talking mostly to newby traders who may not have a clue as to just how much they can lose before they get really good and consistently profitable. Blow up a couple of accounts, then come talk to me about stops.
BTW, I enjoy the conversation and differing opinions.
Hey RT! Any chances of you giving a glimps of your trading system or point me in a direction where I can find good answers? Thanks!
Emmet, how many times the “disaster stop loss” of $1000 was hit in the testing period. Win-Loss ratio of 48-50% is little difficult but the equity curve is 45 degrees over 15 years which rare to find and strong mental boost to keep on taking the trades. Btw, any strategies for the last 30 minutes of the trading day.
Sounds like a fun challenge. You want me to find a strategy that takes trades the final 30 minutes of the day.
Lets see what I come up with.
Thx alot Emmet. I can’t code, so backtesting is always a challenge. It seems last 30 minutes markets do tend to find a bias for a direction and stick to it.
You can code. You’re just lazy.
Lol, so true !!
How and where can I learn how to code my trading plan?